Scientists bring to light how visual functions are hardwired in the brain
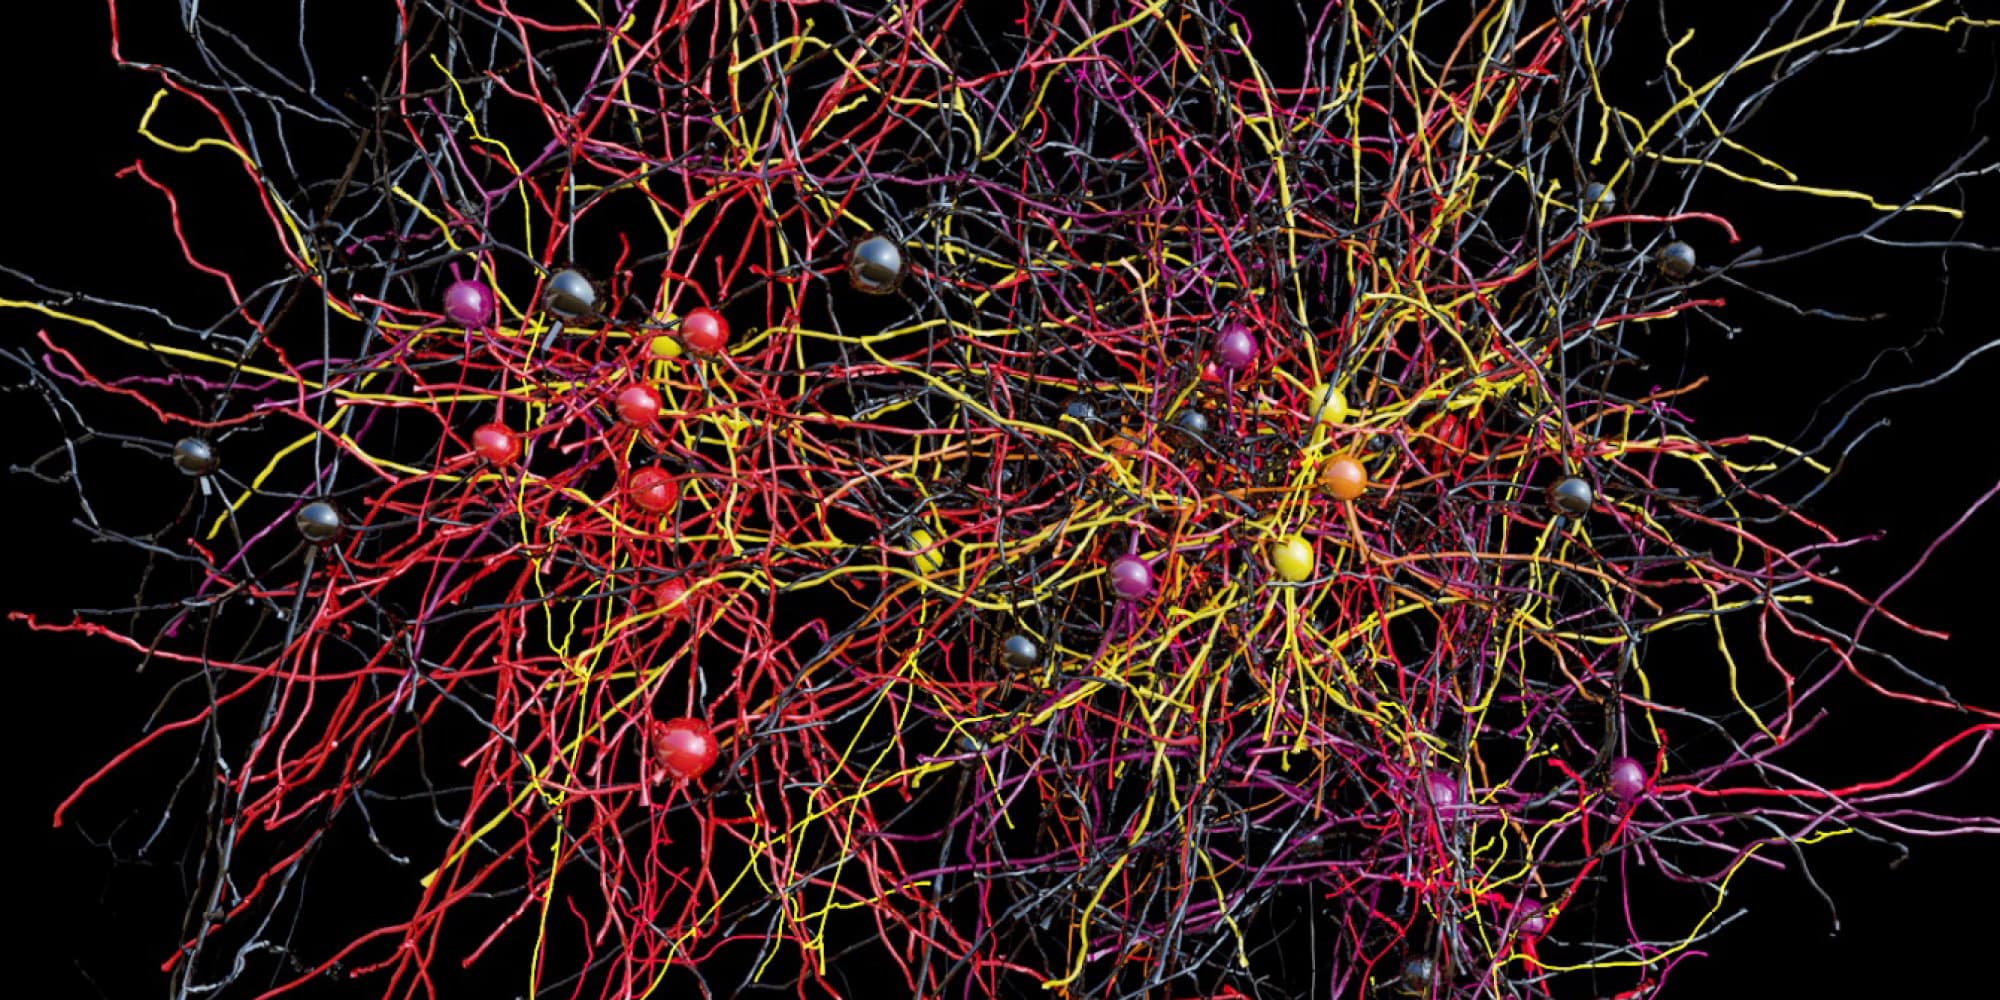
For decades, researchers have studied the function of the brain and its wiring in isolation. But now a group of scientists including imec researcher Vincent Bonin from NERF (Neuro-Electronics Research Flanders) have bridged these realms in unprecedented detail. They were able to link functions of image recognition to actual groups of neurons in the visual cortex and the synaptic connections between them. The study reported in Nature reveals specific connections between neurons that react to the same visual stimulus, resulting in a modular structure. The work also presents a considerable leap forward in the techniques that were used and the sheer volume of data that was collected and that is now made public for further research.
From the eyes to the brain
The main area of interest for the study was the primary visual cortex. According to Bonin, this is the area of the brain for which there is the highest potential that we may fully understand it in the shorter term. The visual cortex can be seen as a switchboard processing visual inputs that come from the eyes and sending the result to other parts of the brain. Neurons in the visual
cortex function as edge detectors. Each neuron has a preference for a certain shape or line, including the dimension and orientation. So, for example, if the eye sees a horizontal line or a line tilted to 45 degrees, different cells in the visual cortex will fire.
Vincent Bonin: “There is a longstanding hypothesis that cells reacting to the same shapes are wired to each other. So there would e.g. be a group of cells – a brain module – with a preference for horizontal lines. It’s an idea that would make for very robust image recognition, because it allows amplifying signals. There has been physiological data that corroborated this hypothesis. But until recently, researchers have only been able to show these amplifying connections for a few neurons at a time, not anywhere near to what we could call a circuit or module.
Through a multidisciplinary, collaborative effort, we have been able to demonstrate these preferential connections between many neurons.
What we have done first is to observe and record the preferences of neurons for certain edges. Then we mapped out the physical connections between the neurons for which we knew the preference. That way, we could show not only that neurons with equal function are preferentially connected to each other, but also that these connections are stronger than other connections they may also have. So we have provided support for the idea that there is amplification of visual features and that this amplification is done by connecting cells into some form of visual modules.”
The method of working that the scientists followed is a fairly new one called functional connectomics. To make it work at this scale of detail proved to be a technical tour de force.

Vincent Bonin, principal investigator NERF.
Let there be light
As a first step, the team wanted to identify a large number of visual neurons by way of their function, i.e. the shape or edge they react to. To do so, they used a particular mouse with genetically modified neurons in the visual cortex that became visible under fluorescent light when they fired. The idea is that you then show the mouse certain shapes and at the same time
make a visual recording of the corresponding activity in the brain using a very sensitive fluorescence microscope.
Vincent Bonin: “The in vivo imaging experiments were conducted when I was still a researcher at Harvard Medical School. After recording for 20 days, we had tens of hours of high-resolution visual recordings of this tiny brain region that we focused on, a region that measures less than a square millimeter. In parallel to these recordings, we had the corresponding lines and shapes that we had displayed and that had elicited the brain activity.”
Fascinating material, where you see a set of very specific neurons reacting to a horizontal line and a totally other group lighting up when shown a 30 degrees tilted edge. But on itself, this did not tell the researchers much about the wiring, the circuits behind what they saw. Therefore they needed to create a detailed map of the neurons and their connections in that particular brain region.
A huge 3D data cube
Vincent Bonin: “To get that information, my colleague Wei-Chung Allen Lee had to make a 3D image of the brain region in very high resolution. If you want to see if two neurons are connected, you need to examine the synapses in detail. These synapses are a few tens of nanometers wide, but where they touch, they are only 10nm apart. And you really need to see that synaptic cleft to judge whether there is a connection.
So Wei-Chung isolated that tiny brain region, prepared it, and diced it into over 3,000 slices of 40nm width. These slices were then photographed with a customized transmission electron microscope that imaged small overlapping regions, and stitched together to get a full picture of the slice. All in all, this resulted in 100TB of data, a three-dimensional picture of a brain region in unprecedented detail.
That was one of the last projects I participated in as a postdoc at Harvard. At the time I moved to Belgium to set up my lab at imec, we had the full data set ready. That was 5 years ago, and it took us so long to do the final analysis of that data and come up with these exciting conclusions.”
A pattern of very specific connections
So after these complex recordings and visualizations, Bonin and his fellow researchers had the in vivo recordings and 100TB of high-resolution pictures of the brain slices. They could now map these onto each other by using the tiny blood vessels that ran through this brain section as anchors. The researchers were especially interested in cells that showed visually selective activity on the live recordings and those that were connected to them. Were these neurons somehow connected according to what they reacted to? Or are connections between neurons just statistically distributed, without preference?
Vincent Bonin: “Each pyramidal neuron in the visual cortex makes thousands of connections. The part of the neuron with the incoming connections, the dendrites, can run over hundreds of micrometers. This means that to track only one of these dendrites to its synapse where it touches another cell, you may have to follow it through a lot of the slices. And then, when you reach the synapse, there is the difficulty of judging if there is a connection.
Based on the neural responses we saw in the recordings, we selected 48 cells. We then trained teams of annotators who traced and validated the connections made with these neurons. Their decisions were checked multiple times by pitting them against each other. In the end, we only kept those neurons and connections for which there was a consensus.”
So what the scientists eventually saw appearing on their monitors was a pattern of very specific connections. Vincent Bonin: “As we had hypothesized, the visual cortex is organized in subnetworks, each with a preference for one orientation of edges. These networks are implemented through specific connections. Two neurons that have a preference for the same shape will form more and stronger connections than they do with other neurons. And this despite that fact that many other neurons and dendrites pass nearby.”
Functional connectomics, the road ahead
On hearing Vincent Bonin, the work has just started. The project’s scientists will now set their detailed brain pictures online, the first volume of this kind that is becoming publically available. The idea is that many more people start to work on mapping out more of the recorded neurons and their connections. The pictures may even be used to start writing smart image recognition algorithms to speed up the mapping.
Vincent Bonin: “A next step would be to map out the primary visual cortex of a mouse completely. Seeing what we have already covered, the whole visual cortex of a few mm2 seems a tractable challenge. Also, we want to study the visual function of many more neurons in more detail. These visual neurons tend to react quite spiky, with specific, short reactions that are easy to miss. So by randomly presenting shapes and lines, it may take a long time to call each neuron’s function.”
This study has shown that functional connectomics is a powerful method to uncover the organization and logic of cortical networks. As the techniques for image recognition and reconstruction get more refined and automated, scientists will be able to scale up the effort. This will lead to a richer understanding of how the functions of the brain are implemented.
References
- Wei-Chung Allen Lee, Vincent Bonin, Michael Reed, Brett J. Graham, Greg Hood, Katie Glattfelder, R. Clay Reid. Anatomy and function of an excitatory network in the visual cortex. Nature, 2016; DOI: 10.1038/nature17192
- The website of NERF (Neuro-Electronics Research Flanders): www.nerf.be
Published on:
19 December 2016


